
Table of Contents
Introduction: The Cost of a Sluggish Web Experience
We live in an era of micro-attention spans. If your website takes more than two seconds to load, your potential customers are already hitting the back button and finding your competitor. In 2026, speed is not just a technical metric or a luxury for big tech giants—it is directly correlated to your business revenue.
Whether you run an e-commerce store, a SaaS platform, or a corporate lead-generation website, slow load times act as a silent leak in your marketing budget. Every second of delay directly reduces customer trust and conversion rates.
The Conversion Killer: The Cold Hard Speed Metrics
Studies consistently show that faster websites make more money. Even a minor delay has compounding negative effects on your sales funnel:
- Bounces increase: A site that takes 3 seconds to load has a 32% higher bounce rate than a site loading in 1 second. At 5 seconds, that probability shoots up to 90%.
- Rankings drop: Google uses page speed (Core Web Vitals) as a direct ranking signal. Slow sites are pushed down to page 2 or 3 of search results.
- Conversion rates drop: According to WebDev researchers, the first few seconds of page load time have the highest impact on conversion rates. In fact, a 1-second delay can drop checkout conversions by up to 7%.
Key Takeaway: Speed is the foundation of digital marketing. If your landing pages load slowly, you are actively paying to send users to a site they will immediately leave.

Understanding Core Web Vitals in 2026
Google measures user experience using three main metrics, known collectively as Core Web Vitals. To keep your website rank and conversions high, you must optimize for all three:
1. Largest Contentful Paint (LCP)
LCP measures perceived load speed. It marks the point in the page load timeline when the main content has likely loaded. Your target should be under 2.5 seconds.
2. Interaction to Next Paint (INP)
INP measures overall responsiveness. It evaluates the latency of all user interactions (clicks, taps, keyboard inputs) on the page. Your target should be under 200 milliseconds.
3. Cumulative Layout Shift (CLS)
CLS measures visual stability. It quantifies how much elements unexpectedly shift while the page is rendering (such as buttons shifting down as an image loads). Your target should be a score of 0.1 or less.
Learn more about our custom website development service to see how we build high-performance, sub-second architectures.
How to Optimize Your Stack for Maximum Speed
To achieve sub-second speeds, you need to implement professional, code-level optimizations:
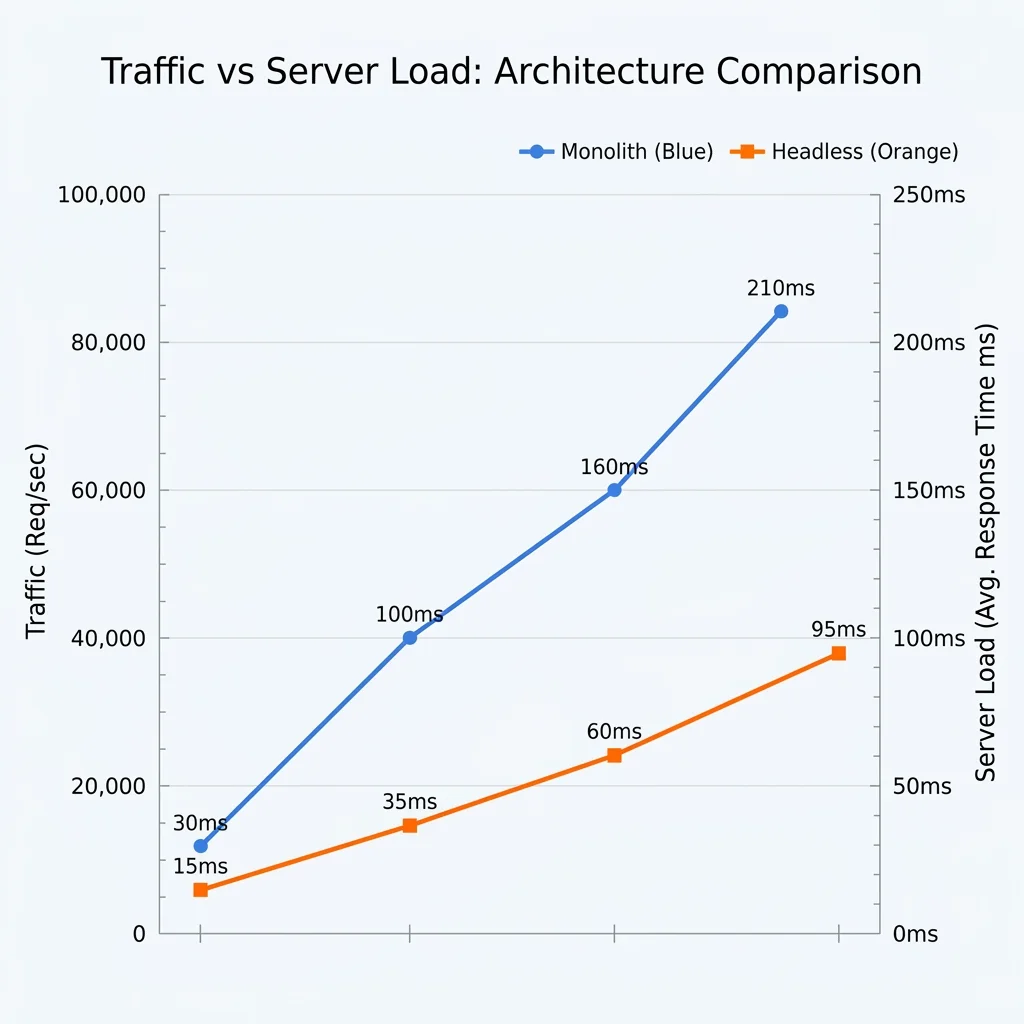
- Use decoupled architectures: Separating the frontend rendering (using Next.js or static generation) from the database prevents server-side query lag from delaying the initial page load.
- Optimize database queries: Implement eager loading of relationships to prevent N+1 queries, and index key columns that are frequently used in search queries.
- Implement aggressive caching: Cache static assets and database model queries to ensure the server can serve pages without querying the database every time.
Read our comparative guide on custom website architecture vs. page builders to see how bespoke engineering outperforms drag-and-drop systems.
Conclusion: Every Millisecond Matters
Optimizing website speed is not a one-time project; it is an ongoing commitment to user experience and revenue generation. By tracking your Core Web Vitals and building on lightweight frameworks, you ensure your business remains competitive, visible, and profitable. Do not let slow pages cost you customers.


